What is the issue?
- The 'SDG India Index: Baseline Report 2018' was recently released by the NITI Aayog.
- But the methodology used leads to the assessment falling short of reflecting the true picture.
What is the report on?
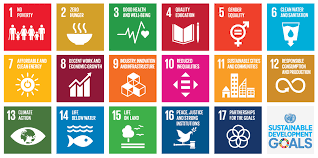
- India was one among the 193 United Nations member states to adopt the Sustainable Development Goals (SDGs) in 2015.
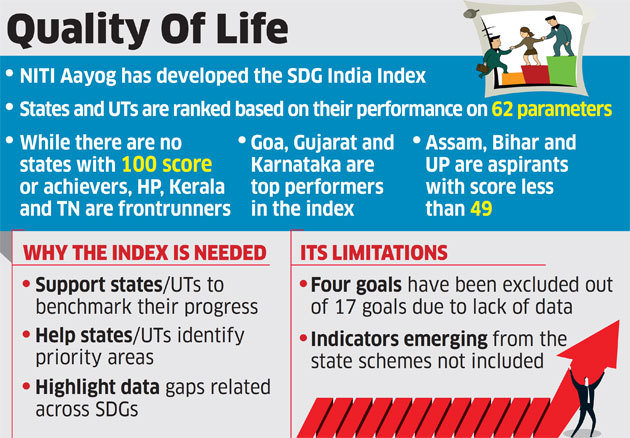
- The report offers a comparative account on the performance of the States and UTs in India in their efforts to achieve the SDGs.
- The index comprises a composite score for each State and UTs based on their aggregate performance across 13 of the 17 SDGs.
- The score, ranging between 0 and 100, denotes the average performance of the State/UT towards achieving the goals and their respective targets.
- The average Indian score was 57.
- On the whole, 62 indicators representing 14 goals (of 17 SDGs) have been identified based on their measurability across States over time.
- It has not been possible to establish suitable indicators for three of the 17 goals, including climate action (SDG-13).
What are the report highlights?
- Based on a scale of 0 to 100, the States are categorised into four groups - achievers, front runners, performers, and aspirants.
- Achievers are those States which have already accomplished the set target.
- Front runners are those States that are very close to realising them.
- A majority of the States are categorised as 'performers' and the states which lag behind are categorised as 'aspirants'.
- Himachal Pradesh, Kerala, and Tamil Nadu are the three front runner States with a score of 69, 69 and 66 respectively.
- Among the UTs, Chandigarh is the front runner with a score of 68.
- Overall, the average score for the States was the worst in -
- gender equality (36)
- creating sustainable cities and communities (39)
- enabling industry, innovation, and infrastructure (44)
- eradicating hunger (48)
Why is the assessment flawed?
- Despite classification being an appropriate method, there is arbitrariness in the assessment exercise.
- It is found that many States fall into the aspirant category, especially for SDG-5, SDG-9 and SDG-11.
- These kinds of differences could be due to a different number of indicators considered under different SDGs as well as their corresponding variability across the States.
- This is evident in the variation of scores across different goals among the states.
- E.g. For goals 1 and 2, the range for the majority of the States is between 35 and 80; for goals 3 and 6, it is between 25 and 100.
- Given these variations across different goals, merely averaging them would compromise the uniqueness of each state.
- Resultantly, there seems to be a negatively skewed distribution of scores among the states.
- It hints at a purposive designation of a few States in two extremes (achievers and aspirants) and a major share of them in between (front runners and performers).
- Moreover, categorisation does not reflect the difference between two states of the same category (the gap) in achieving a goal.
What can be done?
- Setting simple averages as targets for all states for each of the goals overlooks the aspect of inter-dependence of various goals.
- A geometric average would ensure that achievement of progress in one goal cannot compensate for compromise in another.
- The choice of indicators representing specific goals, beyond availability, should also have proper representation without duplication.
Source: The Hindu
