0.2087
7667766266
x

All about Index of Industrial Production

iasparliament Logo
January 17, 2019

What is the issue?

  • Central Statistics Office's (CSO) recent data show that factory output growth had slipped to a 17-month low in November, 2018.
  • In this backdrop, it is appropriate to understand the Index of Industrial Production (IIP) on which the above data is based on.

What is IIP?

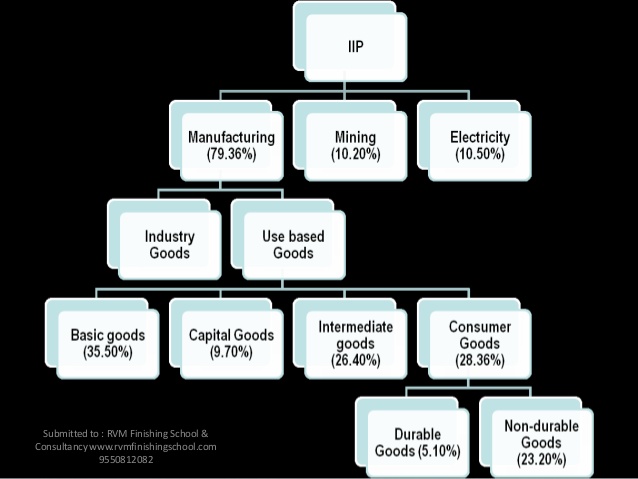
  • IIP is a composite indicator measuring changes in the volume of production of a basket of industrial products over a period of time, with respect to a chosen base period.
  • It is compiled and published on a monthly basis by the CSO with a time lag of six weeks from the reference month.


Why is IIP significant?

  • IIP is the only measure on the physical volume of production.
  • The all-India IIP provides a single representative figure to measure the general level of industrial activity in the economy.
  • It is used by government agencies including the Ministry of Finance, the Reserve Bank of India etc, for policy purposes.
  • It forms a crucial input for compilation of Gross Value Added (GVA) of the manufacturing sector in the Gross Domestic Product (GDP) on a quarterly basis.
  • IIP remains extremely relevant for the calculation of the quarterly and advance GDP estimates.
  • It is also used extensively by financial intermediaries, policy analysts and private companies for various analytical purposes.

What was the change in 2017?

  • The change in the base year of the all-India IIP to 2011-12 happened in 2017.
  • It was the ninth revision of base year of the all-India IIP since the beginning of its dissemination.
  • In the 2011-12 series, as compared to 2004-05 series, a number of items were introduced or deleted.
  • In all, 149 new items were added in the new IIP 2011-12 data series, and 124 of them were deleted.
  • [Items such as refined palm oil, cement clinkers and surgical accessories were introduced. Tooth brushes, chewing tobacco, fans, calculators, pens and watches were removed.]
  • This helped check the volatility of the index that was earlier seen especially for capital goods.
  • A change in the base year should not end up making too much difference to the IIP growth figures.
  • But the bigger impact is on account of the difference in the constituent items of the index and weights assigned to each of them.

What is the Annual Survey of Industries?

  • The ASI (Annual Survey of Industries) is the main source of long term industrial statistics.
  • Notably, the IIP is a monthly indicator based on items and factories selected from ASI.
  • For the annual revised estimates, the CSO replaces the IIP with the ASI.

Why do IIP and ASI differ?

  • The IIP is based on a fixed set of items and factories chosen in the base period.
  • Whereas, the ASI is a record-based survey of establishments registered under the Factories Act, 1948.
  • Here, the sampling frame and the sampled establishments undergo significant changes.
  • Consequently, the ASI captures information of new items and factories whereas the IIP does not.
  • Growth rates in IIP are based on volume of production whereas growth rates in ASI are derived on the basis of Value Added (Output – Input).
  • Also, the IIP is based on a much smaller sample of factories as compared to that of ASI.
  • Further, establishments selected in IIP are generally larger in size whereas ASI establishments cover both large and smaller units.
  • So, the growth rates in IIP are lower as the smaller units with thinner base show higher growth (ASI).
  • As a result of all these, there is divergence in the growth rates of manufacturing sector based on the two datasets (IIP and ASI).


Source: Indian Express

Login or Register to Post Comments
There are no reviews yet. Be the first one to review.

ARCHIVES

MONTH/YEARWISE ARCHIVES

sidetext
Free UPSC Interview Guidance Programme
sidetext