0.2103
7667766266
x

Economic Survey 2018-19 Highlights - Part III

iasparliament Logo
July 07, 2019

Click here for Part II and here for Part I

Why in news?

The Union Minister for Finance and Corporate Affairs, Ms. Nirmala Sitharaman tabled the Economic Survey 2018-19 in the Parliament.

What are the key highlights?

EXTERNAL SECTOR

  • World Trade - As per WTO, World trade growth has slowed down to 3% in 2018, much below the growth rate of 4.6% in 2017.
  • This was mainly because of -
    1. the introduction of new and retaliatory tariff measures
    2. heightened US-China trade tensions
    3. weaker global economic growth
    4. volatility in financial markets
  • India’s balance of payment situation witnessed some signs of deterioration during H1 of 2018-19.
  • This was due to the sharp rise in crude oil prices, causing higher current account deficit (CAD), in turn, due to higher trade deficit.
  • However, CAD moderated somewhat in Q3-2018-19 as international crude oil prices eased sequentially towards the end of 2018.

  • Trade - The growth rate of merchandise exports and imports fell in 2018-19 compared to previous year.
  • This was attributable to the slower growth of world output and trade, along with lower domestic GDP growth in 2018-19, among other factors.
  • The contribution of net services to financing merchandize trade deficit has fallen from around 62% in 2016-17 to around 43% in 2018-19.
  • This reflects a weak performance of service exports in recent times.
  • Notably, during first half of 2017-18, the Net surplus in the services had financed about 49% of India’s merchandise deficit.
  • Capital flows - Net capital flows moderated in April-December of 2018-19.
  • This was despite robust foreign direct investment (FDI) inflows as it was outweighed by withdrawals under portfolio investment.
  • Remittances - India remained a top remittance recipient country in 2018.
  • The net remittances by Indians employed overseas increased in 2018-19 (P-Provisional) compared to last year.
  • This is possibly due to improved income conditions in the Gulf countries, along with rise in oil prices.

  • Foreign Exchange - Among the major economies running current account deficit, India is the largest foreign exchange reserve holder.
  • India is also the 8th largest among all countries of the world in this regard.

  • India’s External Debt was US$521.1 billion at end-December 2018, 1.6% lower than its level at end-March 2018.
  • The key external debt indicators reflect that India’s external debt is sustainable.
  • Total liabilities-to-GDP ratio, inclusive of both debt and non-debt components, has declined from 43% in 2015 to about 38% at end of 2018.
  • The share of foreign direct investment has risen and that of net portfolio investment has fallen in total liabilities.
  • This reflects a transition to more stable sources of funding the current account deficit.
  • Indian Rupee traded in the range of 65-68 per US$ in 2017-18 but depreciated to a range of 70-74 in 2018-19.
  • During H1 of 2018-19, rupee remained weak due to concerns related to -
    1. widening of CAD owing to rising crude oil prices
    2. tightening of financial conditions caused by increase in Federal Funds rate by the US Federal Reserve
  • Import - The income terms of trade is a metric that measures the purchasing power to import.
  • This has been on a rising trend, possibly because the growth of crude prices has still not exceeded the growth of India’s export prices.
  • Exchange rate in 2018-19 has been more volatile than in the previous year.
  • This was mainly due to volatility in crude prices, but not much due to net portfolio flows.
  • Trade composition - Composition of India’s exports and import basket in 2018-19 (P):
  1. Exports (including re-exports) - around Rs. 23, 07,000 Cr
  2. Imports - around Rs. 35, 94,000 Cr
  • The composition of India’s exports and import basket has almost remained unchanged in 2018-19 over 2017-18.
  • Petroleum products, precious stones, drug formulations, gold and other precious metals continue to be top export items.
  • Crude petroleum, pearl, precious, semi-precious stones and gold remain as top import items.

  • Trading Partners - India’s main trading partners continue to be the US, China, Hong Kong, the UAE and Saudi Arabia.
  • India has signed 28 bilateral/multilateral trade agreements with various country/group of countries.
  • In 2018-19, India’s exports to countries with which it has a trade agreement stood at US$121.7 billion.
  • This accounts for close to 37% of India’s exports to all the countries.
  • Similarly, in the same year, India’s imports from countries with which it has a trade agreement stood at US$266.9 billion.
  • This accounts for 52% of India’s imports from all the countries.

  • Logistics industry of India is currently estimated to be around US$215 billion.
  • There have been significant developments in this industry.
  • This has led to an increase in India's rank in World Bank's 2016 Logistics Performance Index.
  • In 2018, India stood at 44th rank.

AGRICULTURE AND FOOD MANAGEMENT

  • Contribution - The contribution of Agriculture’s Gross Value Added (GVA) to overall GVA has been declining (14.4% in 2018-19).
  • Gross Value Added (GVA) in agriculture improved from a negative 0.2% in 2014-15 to 6.3% in 2016-17.
  • But it again decelerated to 2.9% in 2018-19.
  • However, agriculture is still a crucial sector, as a large proportion of the population engage in agriculture.

  • Gross Capital Formation (GCF) in agriculture as percentage of GVA declined to 15.2% in 2017-18, as compared to 15.6% in 2016-17.
  • The public sector GCF in agriculture as a percentage of GVA increased to 2.7% in 2016-17 from 2.1% in 2013-14.

  • Women’s participation in agriculture has increased to 13.9% in 2015-16 from 11.7% in 2005-06.
  • Their concentration is now the highest (28%) among small and marginal farmers.
  • Land holdings - The number of operational land holdings and area under operation have shifted towards small and marginal farmers.
  • Water use - Around 89% of groundwater extracted is used for irrigation.
  • Crops such as paddy and sugarcane consume more than 60% of irrigation water.
  • The States like Tamil Nadu, Karnataka, Maharashtra and Andhra Pradesh, which have high land productivity, tend to have very low irrigation water productivity.
  • So, the focus should shift from land productivity to ‘irrigation water productivity’.
  • Therefore devising policies to incentivize farmers to improve water use should become a national priority.
  • Thrust should be on micro-irrigation that can improve water use efficiency.
  • Fertilizer response ratio has been declining over time.
  • In this regard, organic and natural farming techniques including Zero Budget Natural Farming (ZBNF) can improve both water use efficiency and soil fertility.

  • Technology adoption - Over the years, several new challenges have emerged before the sector including fragmentation of agricultural holdings and depletion of water resources.
  • So, adoption of a resource-efficient, ICT based climate-smart agriculture can enhance agricultural productivity and sustainability.
  • Adopting appropriate technologies through Custom Hiring Centers and implementation of ICT should be strategized.
  • Significantly, small-holder farming can be a profitable livelihood opportunity with the application of appropriate technologies.
  • Diversification of livelihoods is critical for inclusive and sustainable development in agriculture and allied sectors.
  • Policies should focus on
  1. dairying (India is the largest producer of milk)
  2. livestock rearing particularly of small ruminants
  3. fisheries sector (India is the third largest producer)
  • Food security - Agriculture is critical for the country’s food security.
  • The rationalisation of food subsidy and greater use of technology in food management will ensure food security for all.

INDUSTRY

  • The industrial growth in terms of Index of Industrial Production (IIP) registered 3.6% in 2018-19 as compared to 4.4% growth rate in 2017-18.
  • The moderation in IIP growth is mainly due to subdued manufacturing activities in Q3 and Q4 of 2018-19.
  • This, in turn, was due to -
  1. slower credit flow to medium and small industries
  2. reduced lending by NBFCs owing to liquidity crunch
  3. tapering of domestic demand for key sectors such as automotive sector, pharmaceuticals, and machinery and equipment
  4. volatility in international crude oil prices, etc
  • Meanwhile, the overall Index of Eight Core Industries registered a growth rate of 4.3% in 2018-19 similar to the increase achieved in 2017-18.

  • India has considerably improved its ranking to 77th position (leapt 23 ranks) in 2018 among 190 countries assessed by the World Bank Doing Business (DB) Report, 2019.

INFRASTRUCTURE

  • Building sustainable and resilient infrastructure has been given due importance with the formulation of sector specific programmes such as SAUBHAGYA scheme, PMAY etc.
  • Road construction grew at 30 kms per day in 2018-19 as compared to 12 kms per day in 2014-15.
  • Rail freight and passenger traffic grew by 5.33% and 0.64% respectively in 2018-19 as compared to 2017-18.
  • Total telephone connections in India touched 118.34 crore in 2018-19.
  • The installed capacity of electricity has increased from 3,44,002 MW in 2018 to 3,56,100 MW in 2019.
  • The challenge ahead is to mobilize adequate investment in infrastructure sector, which runs into several trillions of dollars.
  • Public Private Partnerships are essential for addressing infrastructure gaps in the country.
  • There is also a need for establishing an institutional mechanism to deal with time-bound resolution of disputes in infrastructure sectors.

SERVICES SECTOR

  • Services sector (excluding construction) has a share of 54.3% in India’s GVA.
  • It has contributed more than half of GVA growth in 2018-19.
  • The services sector growth declined marginally to 7.5% in 2018-19 from 8.1% in 2017-18.
  • This was driven by deceleration in the growth of sub sectors such as trade, hotels, transport, communication and broadcasting services.
  • However, growth of financial services, real estate and professional services accelerated.
  • It is to be noted that India’s services sector does not generate jobs in proportion to its share in GVA.
  • Service sector's share in employment is 34% in 2017 which is significantly lesser that its share of 54% in GVA.
  • During 2018-19, FDI equity inflows into service sector fell by US$696 million or 1.3% from the previous year to about US$28.26 billion.
  • In services, the IT-BPM (business process management) industry grew by 8.4% in 2017-18 to US$167 billion.
  • It is estimated to reach US$181 billion in 2018-19.
  • Tourism - India received 10.6 million foreign tourists in 2018-19 compared to 10.4 million in 2017-18.
  • The foreign exchange earnings from tourism stood at US$27.7 billion in 2018-19 compared to US$28.7 billion in 2017-18.

SOCIAL INFRASTRUCTURE, EMPLOYMENT AND HUMAN DEVELOPMENT
  • The 17 SDGs (Sustainable Development Goals) and 169 targets envisaged in the Agenda 2030 of the UN, are closely interrelated with social infrastructure.
  • The public investments in social infrastructure like education, health, housing and connectivity have a critical role in ensuring inclusive development in a developing country like India.
  • Consequently, the improvement in HDI is also interlinked to SDGs as evidenced in the correlation between SDG rankings and HDI rankings of the States.

  • HDI - India’s HDI (Human Development Index) has improved significantly over the years between 1990 and 2017.
  • The country’s HDI value increased from 0.427 to 0.640, but its position is still lowest among its peer countries (Asian and developing economies).
  • As per the UNDP Human Development Index (HDI), India is ranked 130 among 189 countries.
  • Moreover, India also reflects inter-State disparities in regional and human development, which are reflected by State level HDIs.

  • Education - In India, the percentage of GDP expended on education has remained stagnant at around 3%.
  • With the available resources, India has made substantial progress in both quantitative and qualitative indicators of education.
  • This is reflected in the improvements in -
    1. Gross Enrolment Ratios
    2. Gender Parity Indices
    3. learning outcomes at primary school levels
  • However, the rural urban disparities in access to quality schooling and drop out rates at senior secondary levels remain areas of concern.
  • Skilling - The Skilling ecosystem in India is equipping the youth to meet the challenges of a dynamic labour market.
  • Short-term and long-term skilling are facilitated under programmes like Pradhan Mantri Kaushal Vikas Yojana (PMKVY).
  • PMKVY has had positive impact on employment and incomes of the youth as per evaluation studies.
  • The suggestions made in this regard in the Survey include -
    1. introduction of the skill vouchers as a financing instrument to enable youth obtain training from any accredited training institutes
    2. involving industry in setting up of training institutes in PPP mode, in curriculum development, in provision of equipment, in training of trainers, etc
    3. roping in personnel of Railways and para-military for imparting training in difficult terrains
    4. creating a database of Instructors, skill mapping of rural youth by involving local bodies to assess the demand-supply gaps
  • Employment - The PLFS (Periodic Labour Force Surveys) has reported declining LFPR (labour force participation rate) along with increasing unemployment rate.
  • Government has prioritized employment programmes like MGNREGS.
  • This is reflected in the upward trend in budget allocation and release of funds to the States in the last 4 years.

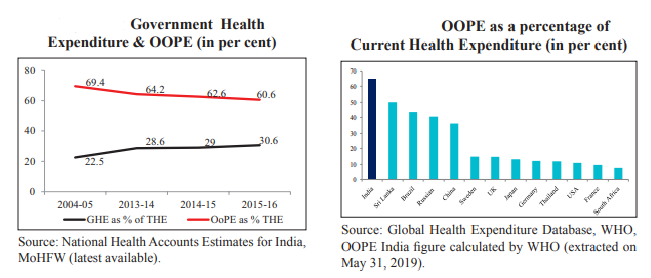
  • Health - The expenditure on health has hovered around 1% of GDP during the past few years.

                         Note: OOPE - Out of Pocket Expenditure; THE - Total Health Expenditure

  • Accessible, affordable and quality healthcare are being provided by the Government under the National Health Mission and through new schemes like Ayushman Bharat.
  • The select health indicators like MMR, IMR, U5MR have shown tremendous improvement over the past few years.
  • Alternative healthcare, National AYUSH Mission, was launched to provide cost effective and equitable AYUSH healthcare.
  • Household autonomy of women is the first step towards achieving empowerment and becoming agents of change in patriarchal societies like India.
  • In this context, financial inclusion initiatives have improved the household autonomy of women as reflected by the NFHS (national family health survey) data.
  • Connectivity is critical for rural areas, to improve quality of lives of the poor by enhancing access to various social services, education, health and access to markets.
  • In this regard, PMGSY (Pradhan Mantri Gram Sadak Yojana) has played a crucial role in connecting the unconnected in rural India and enhanced their livelihood opportunities.
  • Around 1,90,000 km of rural roads were constructed under PMGSY since 2014.
  • Housing - Government has accorded highest priority to rural housing, by providing dwelling with all basic facilities to the most needy under PMAY-G (Pradhan Mantri Awas Yojana - Gramin).
  • About 1.54 crore houses were completed under PMAY as against a target of 1 crore pucca houses with basic amenities by 31st March, 2019.
  • Way Forward - To reap the benefits of demographic dividend, the government is committed to improve the outcomes in education and skilling, and to provide employment and affordable healthcare to all.
  • India's march towards achieving SDGs is firmly anchored in investing in human capital and inclusive growth.


Source: Ministry of Finance Website

Login or Register to Post Comments
There are no reviews yet. Be the first one to review.

ARCHIVES

MONTH/YEARWISE ARCHIVES

sidetext
Free UPSC Interview Guidance Programme
sidetext