0.2262
7667766266
x

Relative Economic Performance of Indian States

iasparliament Logo
September 19, 2024

Why in news?

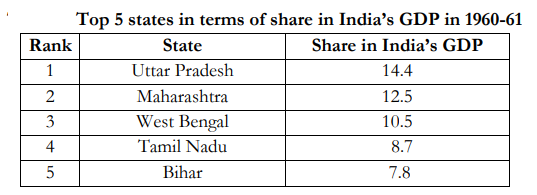
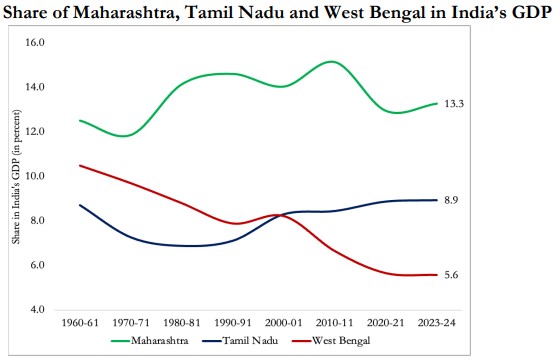
Recently, Economic Advisory Council to the Prime Minister (EAC-PM) has released the paper ‘Relative Economic Performance of Indian States: 1960-61 to 2023-24’.

How has the regional growth changed from 1960 to 2023?

  • In the 1960s, five states, Uttar Pradesh, Maharashtra, West Bengal, Tamil Nadu and Bihar, accounted for about 54 per cent of India’s GDP.

regional disparities

  • Interregional Disparities - Western and Southern regions of India have performed notably better than other parts of the country from 1960-61 to 2023-24.

disparities 2

  • Intraregional Disparities – Within each region, disparities have emerged amongst the States.
  • Maharashtra, Gujarat, Delhi and Haryana have shown steady performance over the last six decades.

Regional Growth (1960-2023)

Southern Region

  • Southern States - Karnataka, Andhra Pradesh, Telangana, Kerala and Tamil Nadu.
  • Since the economic liberalization of 1991, southern States have emerged as the leading performers.
  • They now collectively account for approximately 30% of India’s GDP in 2023-24.
  • Kerala - Only southern state which saw its share in the GDP dip.
  • It’s share increased from 3.4 % in 1960-61 to a peak of 4.1 % in 2000-01, then dipped to 3.8 per cent in 2023-24.

Western Region

  • Maharashtra and Gujarat – Their per capita incomes remained above the national average since the 1960s.
  • In 2023-24, They account for 160.7 % and 150.7 % of the national average.
  • Goa – Its relative per capita income has doubled over the period.

Eastern Region

  • West Bengal – It was the third-largest in 1960-61 with 10.5% of National GDP.
  • It has now declined to only 5.6 % in 2023-24.
  • Odisha – Its relative per capita income increased from 55.8 % in 2000-01 to 88.5 % in 2023-24.
  • Bihar – Its relative position has stabilized in the last two decades; it remains significantly behind other states.


Northern Region

  • Delhi - The Capital had the highest per capita income in 1960-61 at 218.3 per cent of the national average.
  • In 2023-24, Delhi’s relative per capita income was 250.8 per cent.
  • Punjab – Its per capita income was 106.7 % of the national average in 2023-24, down from 119.6 % in 1960-61.
  • Haryana – Its relative per capita income stood at 176.8 % in 2023-24, up from 106.9 % in 1960-61.

Central Region

  • Uttar Predesh - In the 1960s, It was largest economic powerhouse in the country with a share of 14.4 % in India’s GDP.
  • Madhya Pradesh - Its relative per capita income has risen since 2010, following a five-decade period of decline since 1960s.

What are the causes of regional disparities?

  • Green Revolution - Punjab and Haryana gained from rise in income levels after the green revolution in the 1960s.
  • Punjab did not keep pace with the national average and its economic trajectory diverged completely from Haryana.
  • Economic Liberalization - Before 1991, southern States did not show exceptional performance.
  • However, since the economic liberalization of 1991, southern States have emerged as the leading performers
  • Historical Factor - Three presidency towns—Bombay, Calcutta, and Madras—were home to the largest industrial clusters in the country.
  • State Reorganization – Bifurcation of states had reduced the resources available to them and their collective share to the national growth.
  • Policies – State-specific policies on socio economic spheres and Performance of individual States in response to changes in national policies.

What lies ahead?

  • Create policies that are tailored to the needs of different regions and that promote equality of opportunity.
  • Provide fiscal support to lagging regions and ease worker relocation.
  • Improve the quality of education and training to help people adapt to changing job markets.
  • Decentralize industries to encourage balanced regional development.
  • Promote local economies so that all regions benefit from economic activity.
  • Improve connectivity through transport links, access to finance, and cooperation with universities and research centers.

Quick Facts

  • State share in national GDP - It is defined as ratio of state’s Gross State Domestic Product (GSDP)1 to sum of GSDP of all states.
  • This gives an idea of relative economic importance of states.
  • Relative per capita income - It is defined as percentage of per capita Net State Domestic Product (NSDP) of the state to the all-India per capita Net National Product (NNP) or per capita Net National Income (NNI).

References

  1. The Hindu | EAC-PM paper
  2. The Indian Express | Steady growth in west, south states
  3. EACPM | Relative Economic Performance of Indian States Report
Login or Register to Post Comments
There are no reviews yet. Be the first one to review.

ARCHIVES

MONTH/YEARWISE ARCHIVES

sidetext
Free UPSC Interview Guidance Programme
sidetext