0.2123
7667766266
x

India Q2 GDP Data (2021-22)

iasparliament Logo
December 01, 2021

Why in news?

Ministry of Statistics and Programme Implementation (MoSPI) has released the GDP data for the second quarter (July, August and September) of the current financial year (2021-22).

What does the data say?

  • Gross Domestic Product (GDP) - India’s GDP which measures economic activity from the demand side was 8.4% more than it was in the same quarter last year.
  • Gross Value Added (GVA) - India’s GVA which measures economic activity from the supply side was 8.5% more than it was in the same quarter last year.
  • The Indian economy clocked a healthy growth rate of 8.4 % in Q2 of FY 2021-22 due to increased vaccination and an uptick in agriculture, public administration and defence services sectors.
  • High frequency indicators - All high-frequency indicators such as industrial production, vehicle sales, exports, port cargo and rail freight traffic, and GST e-way bills point to the economy growing faster in the second quarter.
  • Gross Fixed Capital Formation (GFCF) - GFCF shows 1.5 % rise over July-September in the pre-pandemic year 2019-20.

To know about Q1 GDP Data (2021-22), click here

What are the takeaways from the GDP data?

GDP = Private consumption (C) + Private investment (I) + Government expenditure (G) + [Exports – Imports] (X-M)
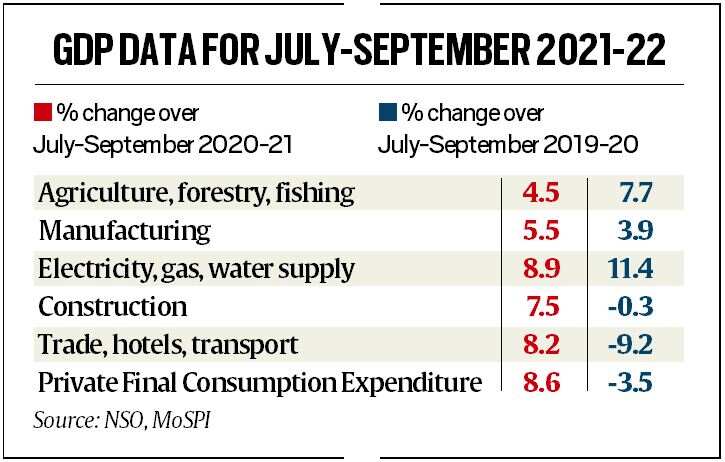
  • Private consumption(C) - Private consumption (which accounts for 55% of all GDP and is the biggest engine of growth) grew by 8.6% over Q2 of last year.
  • But private consumption in Q2 this year was significantly lower than it was in the same quarter two years ago.
  • Investments (I) - The investments made by businesses (which is the second biggest engine of GDP growth, accounting for 33% of all GDP) grew by 11% in Q2 over last year.
  • The firms made more investments in this Q2 than in any Q2 over the last five years which shows optimism on India’s economic recovery.
  • Government’s expenditure (G) – Except last year, the government’s expenditure is the lowest in five years.
  • This shows that at a time when private demand is struggling to recover, the government has not been able to plug the gap.

gdp-data-q2

What are the takeaways from the GVA data?

GVA = GDP + (Subsidies provided by the government) - (Taxes earned by the government)

  • GVA provides a picture about the overall health of the economy and provides information on which sectors are struggling and which are leading the recovery.
  • GVA in better all sectors than it was in Q2 of last year except four key sectors that play a great part in creating fresh jobs.
    1. Mining & Quarrying
    2. Construction
    3. Services such as trade, hotels
    4. Financial services
  • Lower GVA levels would imply lower incomes for those employed in these sectors as well as lower employment opportunities in them.
  • The manufacturing sector posted a growth of 5.5 % and the construction sector grew by 7.5 % in July-September than the same period last year.
  • Agricultural growth increased to 4.5 % in the July-September quarter, while electricity, gas, water supply, and other utility services grew 8.9 % than the last year.
  • In the services sector, the trade, hotels, transport sector grew at 8.2% in July-September as against a sharp 16.1 % contraction last year.

What are the policy implications?

  • Although the economy is recovering from the recession it went into in Q2 of 2020, two data points put the recovery in perspective.
  • India’s recovery is still emerging and a V-shaped recovery would have required the Q2 GDP and GVA to be much higher.
  • So, it may take another two years to cross those levels.
  • The GVA and GDP are around 3.5% and 4.5% respectively, in the first half of the FY 2021-22, which is lower than the first half-year of 2019.
  • If private consumption remains weak there is a threat to future business investments.
  • When such a mismatch happens, it is expected for governments to spend aggressively and boost overall demand but that doesn’t seem to be happening at present and this will likely slow down the recovery.
  • GVA data shows is that several contact-intensive services are struggling to recover levels set in the pre-Covid years with the threat of another variant “Omicron” and it is imperative to ensure sustained policy relief to such sectors.


References

  1. https://indianexpress.com/article/explained/india-gdp-numbers-explained-7649940/
  2. https://indianexpress.com/article/business/economy/india-gdp-q2-results-covid-economy-7648981/
Login or Register to Post Comments
There are no reviews yet. Be the first one to review.

ARCHIVES

MONTH/YEARWISE ARCHIVES

sidetext
Free UPSC Interview Guidance Programme
sidetext