0.1957
7667766266
x

Impact of food inflation on overall inflation

iasparliament Logo
October 28, 2024

Why in News?

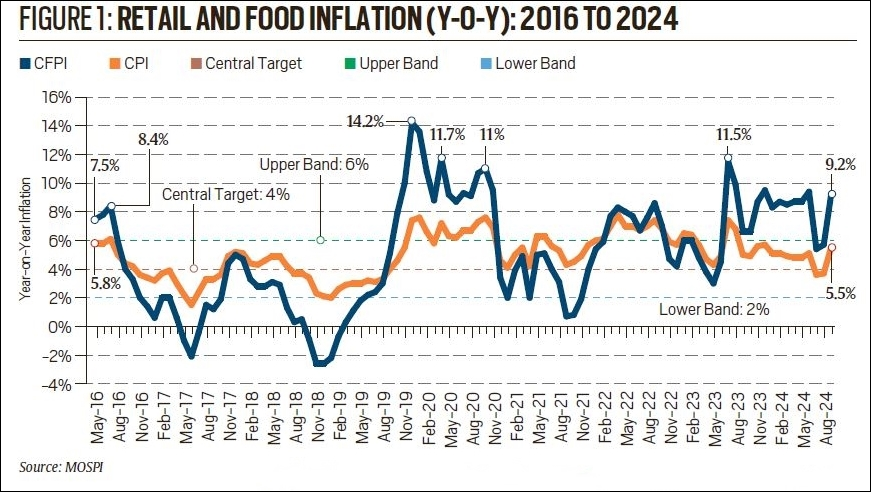
Recently, September inflation, measured by the Consumer Price Index, surged to 5.5 %, while food inflation, crossed 9.2 %.

How food inflation(CFPI) affects overall inflation(CPI)?

  • Consumer Price Index (CPI) – It is a measure of change in retail prices of goods and services consumed by defined population group in a given area with reference to a base year.
  • Released by - Ministry of Statistics and Programme Implementation (MoSPI).
  • Basket of Goods and Services - It represents the level of living or the utility derived by the consumers at given levels of their income, prices and tastes.
  • Share of Consumer Food Price Index in CPI - 39%.
  • Share of Food and Beverages in CPI – 45%.
  • Share of Tomato, Onion, Potato (TOP) - These three vegetables make up 4.8% of the food and beverages group and 2.2% of the overall CPI.

Components of CPI

Group Code

Sub-group Code

Description

Weights

(Rural)

Weights

(Urban)

Weights

(Combined)


1.1.01

Cereals and products

12.35

6.59

9.67


1.1.02

Meat and fish

4.38

2.73

3.61


1.1.03

Egg

0.49

0.36

0.43


1.1.04

Milk and products

7.72

5.33

6.61


1.1.05

Oils and fats

4.21

2.81

3.56


1.1.06

Fruits

2.88

2.90

2.89


1.1.07

Vegetables

7.46

4.41

6.04


1.1.08

Pulses and products

2.95

1.73

2.38


1.1.09

Sugar and Confectionery

1.70

0.97

1.36


1.1.10

Spices

3.11

1.79

2.50


1.2.11

Non-alcoholic beverages

1.37

1.13

1.26


1.1.12

Prepared meals, snacks, sweets etc.

5.56

5.54

5.55

1


Food and beverages

54.18

36.29

45.86

2


Pan, tobacco and intoxicants

3.26

1.36

2.38


3.1.01

Clothing

6.32

4.72

5.58


3.1.02

Footwear

1.04

0.85

0.95

3


Clothing and footwear

7.36

5.57

6.53

4


Housing

-

21.67

10.07

5


Fuel and light

7.94

5.58

6.84


6.1.01

Household goods and services

3.75

3.87

3.80


6.1.02

Health

6.83

4.81

5.89


6.1.03

Transport and communication

7.60

9.73

8.59


6.1.04

Recreation and amusement

1.37

2.04

1.68


6.1.05

Education

3.46

5.62

4.46


6.1.06

Personal care and effects

4.25

3.47

3.89

6


Miscellaneous

27.26

29.53

28.32

General Index (All Groups)

100.00

100.00

100.00

Consumer Food Price Index (CFPI)

47.25

29.62

39.06

  • Components of CFPI -  Out of 12 sub-groups contained in ‘Food and Beverages’ group, CFPI is based on ten sub-groups, excluding ‘Non-alcoholic beverages’ and ‘Prepared meals, snacks, sweets etc.’
  • Impact of food inflation on CPI – In the past 100 months , CPI inflation exceeded the 4 % target 72 % of the time, and in 28 % of the cases, it surpassed the upper threshold of 6 %.

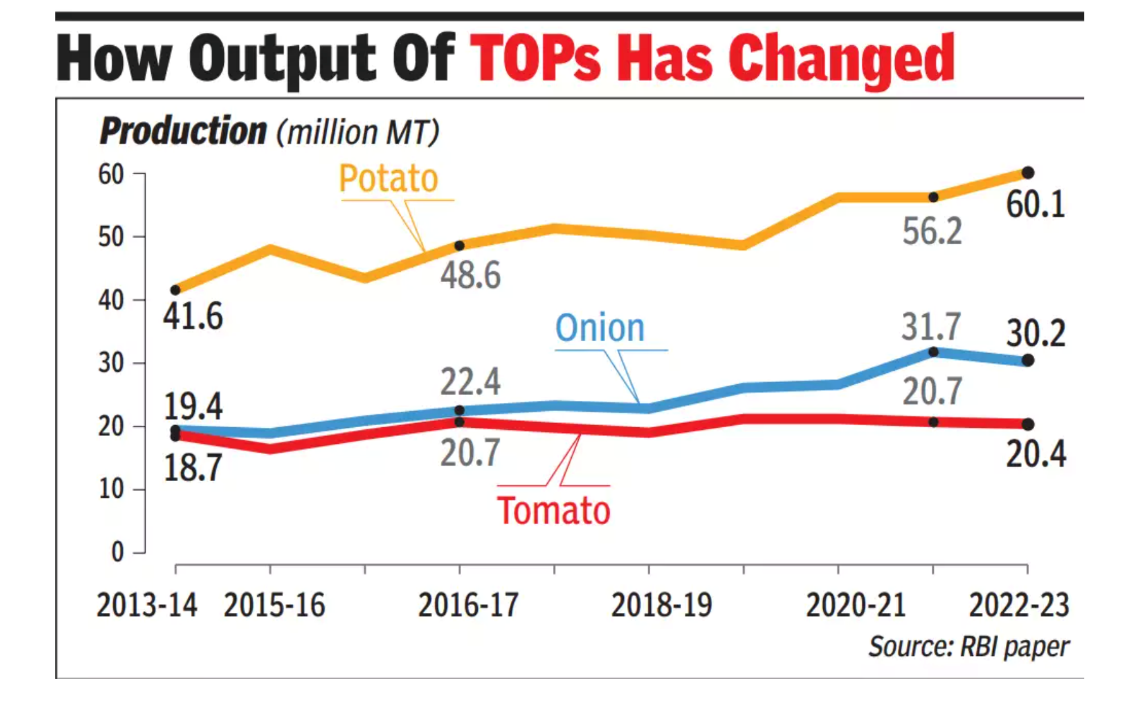
In September 2024, vegetable inflation contributed a staggering 63 % to the food inflation (CFPI), with year-on-year price increases of 42.4 % for tomatoes, 66.2 % for onions, and 65.3 %       for potatoes.

1

  • Ineffectiveness of Monetary Policy - Greater the proportion of food in overall CPI, the harder it becomes for monetary policy alone to control inflation.

What are the reasons for the price fluctuation in TOP crops?

  • Short crop cycles  - During lean seasons, supply shortages lead to high prices, whereas bumper harvests during peak seasons  lead to distress prices.
  • Perishable nature – Tomato is highly perishable and Onion is semi perishable.
  • Storage challenges - Among the three growing seasons, only the rabi onion  can be stored from March to October, serving as a buffer during lean months.
  • Regional production concentration – It makes supply chains vulnerable to disruptions caused by weather events such as heatwaves and floods.

2

  • Structural Challenges -  Issues in the supply chain, such as delays in transportation or distribution, can lead to temporary shortages and price hikes.
  • Adverse climate conditions - Unseasonal rains, droughts, and extreme temperatures can significantly impact crop yields.
  • Fluctuating Price Cycle - It follows the classic “cobweb model” of price cycles, where short supply quickly pushes up prices due to their perishable nature.

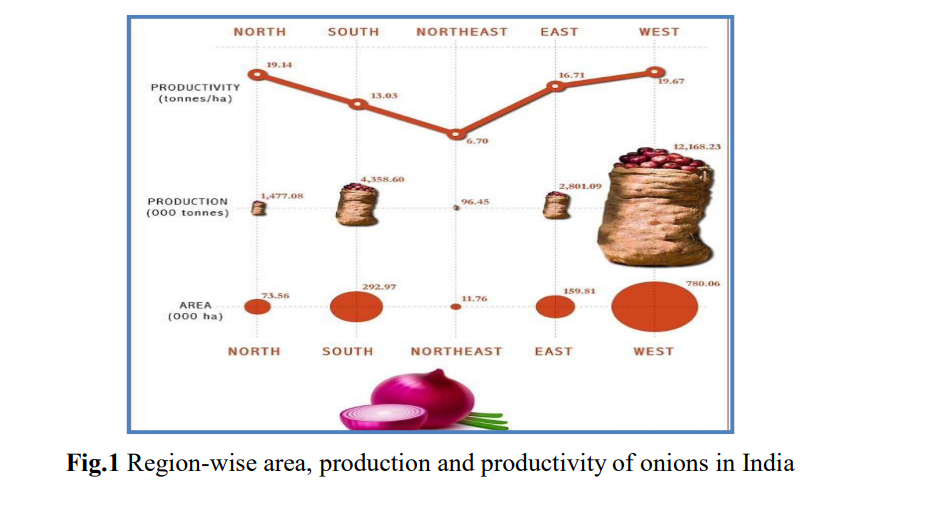
Status of TOP production in India

  • 2022-23 production estimates
    • Tomatoes - 20.4 million metric tonnes (MMT)
    • Onions - 30.2 MMT
    • Potatoes -  60.1 MMT
  • Largest producer of onions, contributing 28.6% of global production.
  • 2nd -largest producer of tomatoes and potatoes.

3

What are the policy recommendations by RBI to curb price volatility?

  • Agricultural Market Reforms - Encouraging the development of private mandis to provide farmers more competitive options for selling their produce.
  • Improving the functioning of existing Agricultural Produce Market Committees (APMCs).
  • Futures Trading - Reintroducing potato futures trading, which was banned in 2014, and exploring the possibility of launching onion futures to enhance price discovery and reduce market risks.
  • Storage Expansion - Developing cold storage infrastructure across the country to prevent losses during peak production.

Cold storage for potatoes is concentrated in Uttar Pradesh, while Maharashtra dominates onion storage, highlighting the need for a more distributed network.

  • Processing and Productivity - Investing in processing facilities and increasing crop productivity to stabilize supply and reduce wastage

What lies ahead?

  • Create a dedicated agency, staffed with experts focused exclusively on these crops.
  • Replace old food weights in CPI with new ones, which are likely to be about 5-6 % points less, to reflect the reality better.
  • Converting at least 10 to 15 % of tomato production into paste and puree and dehydrating onion into products like flakes and powder.

References

  1. The Indian Express | Tomatoes, Onions, and Potatoes Inflation
  2. The Economic Times | Understanding India's food inflation
Login or Register to Post Comments
There are no reviews yet. Be the first one to review.

ARCHIVES

MONTH/YEARWISE ARCHIVES

sidetext
Free UPSC Interview Guidance Programme
sidetext