0.2150
7667766266
x

Prelim Bits 31-10-2018

iasparliament Logo
October 31, 2018

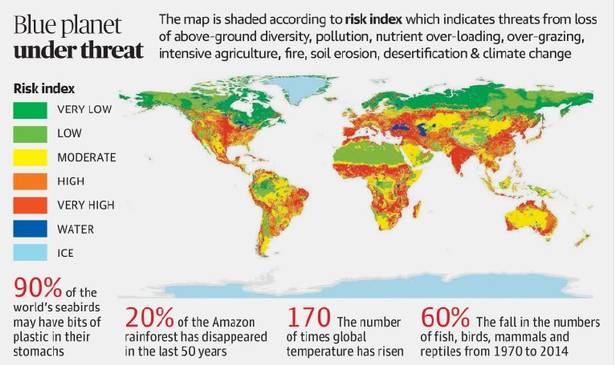
Global Soil Biodiversity Atlas

  • The Atlas is prepared by World Wide Fund for Nature.
  • It indicates risk index which takes in to account, threats from loss of above-ground diversity, pollution and nutrient over-loading, over-grazing, intensive agriculture, fire, soil erosion, desertification and climate change.
  • The two key drivers of biodiversity loss were the over exploitation of natural resources and agriculture.
  • The risk index shows India among countries whose soil biodiversity faces the highest level of risk.
  • The report highlighted that, while India’s per capita ecological footprint was less than 1.75 hectares/person (which is in the lowest band, among countries surveyed) its high population made it vulnerable to an ecological crisis.
  • The other countries which are placed along with India - Pakistan, China, several countries in Africa and Europe, and most of North America.
  • The findings under this are part of the bi-annual Living Planet Report 2018.

Financial Stability and Development Council

  • The council has met recently to discuss the issue of real interest rate, current liquidity situation.
  • FSDC was established in 2010 with Union Finance Minister as its Chairman.
  • Its members include

i. the heads of financial sector regulators (RBI, SEBI, PFRDA, and IRDA)

ii. Finance Secretary, Department of Economic Affairs

iii. Secretary, Department of Financial Services

iv. Chief Economic Adviser

v. Chairman of the Insolvency and Bankruptcy Board

  • FSDC has two core functions:

i. to perform as an apex level forum to strengthen and institutionalize the mechanism for maintaining financial stability

ii. to enhance inter-regulatory coordination and promote financial sector development in the country

  • It focus on financial literacy and financial inclusion.
  • It monitor macro-prudential supervision of the economy and also assess the functioning of the large financial conglomerates.
  • FSDC sub-committee is chaired by the Governor of RBI.

Commercial Paper

  • Commercial Papers are issued by companies with high-quality debt ratings for raising money to meet their short-term liabilities.
  • Corporations, financial institutions, wealthy individuals and money market funds are usually buyers of commercial paper.
  • It is usually issued at a discount from face value and reflects prevailing market interest rates.
  • Maturities on commercial paper are usually no longer than 9 months.
  • Unlike banks, Non-Banking Financial Companies (NBFC) do not have access to low-cost public deposits and have to heavily rely upon commercial paper and commercial debt markets.
  • Banks and Mutual Funds are the main source of funding through commercial papers to NBFCs and housing finance companies.
  • While large MFIs have access to bank finance, the mid-sized and smaller ones depend on funds from NBFCs.
  • Small and mid-size NBFCs and Micro Finance Institutions (MFI) are going to face the liquidity crunch due to redemption of commercial papers due in November-March.
  • Anticipating liquidity crunch, the RBI has announced Rs. 40,000-crore liquidity infusion in November through open market operations.

Dal-Nageen Lake

  • J&K administration has appointed an official for conducting a comprehensive bathymetric survey (study of underwater depth of lake or ocean floors) of the Dal-Nageen lake.
  • The Nageen lake in Srinagar is a deep blue water offshoot of the Dal lake that is interconnected by a thin causeway.
  • The lake is located to the east of the city of Srinagar, at the foothill of the Zabarwan Mountain.
  • The Nageen lake is surrounded by a large number of willow and poplar trees. Hence, it has been referred as a "nageena", which means "the jewel in the ring".

 Multidimensional Poverty Index

  • MPI is a measure that takes into account the incidence of poverty and the extent of deprivation.
  • It is calculated by Oxford Poverty and Human Development Initiative and United Nations Development Programme (UNDP).

  • The MPI value ranges between 0 and 1 and the value of 1 indicates the highest deprivation level, while 0 indicates the lowest.
  • It has been calculated for 105 developing economies.
  • India’s MPI stood at 0.121 in 2016, half of what it was in 2006.
  • India’s MPI is lower than the global average of 0.159 and the South Asian countries but higher than BRICS countries (excluding Russia).


Source: The Hindu


Login or Register to Post Comments
There are no reviews yet. Be the first one to review.

ARCHIVES

MONTH/YEARWISE ARCHIVES

sidetext
Free UPSC Interview Guidance Programme
sidetext